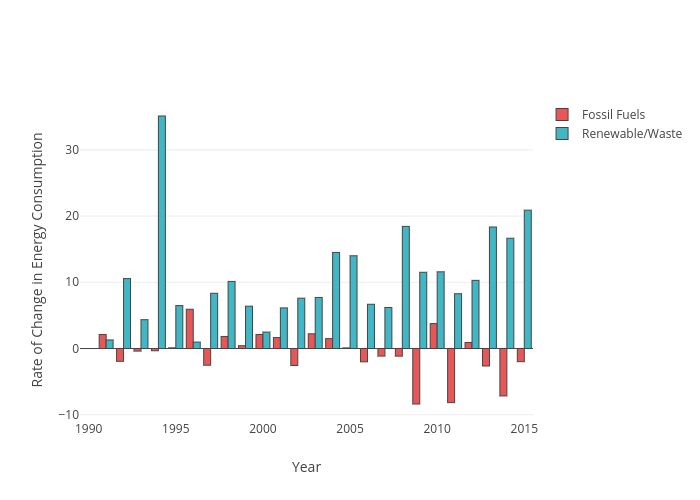
Industry and consumer energy consumption in the UK has come increasingly from renewable and waste sources over the last 25 years (up to 2015), according to data maintained and released by the Ricardo Energy and Environment department of the UK Office for National Statistics. It is important to note that the most recent data still shows fossil fuels as the number one energy source by far; it accounted for 82.9% of total energy consumption in 2015. (For a fuller analysis of the sources of 2015’s energy, see pie chart below). However, there is a clear trend of energy consumption from renewable and waste sources replacing fossil fuel sources. Consumer expenditure, manufacturing and electricity, water, gas, steam and air conditioning were consistently the highest energy usage from both fossil fuels and renewable and waste sources. We cannot compare energy usage from fossil fuels directly with usage from renewable and waste sources because there is a vast difference in scale. However, when we calculate the rate of change from year to year, renewable source consumption rises and fossil fuel consumption drops, particularly between 2008 and 2015. Hover over the bars in the chart below to see how much fossil fuel and renewable and waste sources have grown or shrunk from year to year in the UK. This rate of change was calculated from figures in Millions of Tonnes of Oil Equivalent (Mtoe) on a UK Resident Basis.
When we break down the energy coming from renewable sources further, we can again clearly see this upward trend. In 1990, renewable and waste sources comprised only 0.68% of the UK’s total energy consumption. By 2008 its share was 2.99% and by 2015 it had shot up to 8.6%. The raw numbers are in Millions of Tonnes of Oil Equivalent (Mtoe), which is a unit representing the energy generated by burning one metric ton (1000 kilograms) of oil or 11.63 Megawatt Hours. On a UK Resident basis, they are broken down by year and specific renewable or waste source below. Hover over each area section in the area chart to see the data for each year.
It is extremely important to be aware that, although the energy consumption trend between 1990 and 2015 has been renewable and waste energy sources replacing fossil fuel sources, fossil fuels still account for the vast majority of industry and individual use. Consumption from nuclear sources and net imports to the UK remained fairly consistent throughout the period.